I’ve found it hard to find an intuitive explanation of what an odds ratio is and how it works. So here is my attempt:
Odds ratios describe the relationship between two binary variables. They are often used in impact evaluation to show the relationship between exposure to an intervention (i.e. receiving the intervention vs being in the control group) and a binary outcome (e.g. offending or not).
It’s useful to understand odds before learning about odds ratios. Odds are a way of representing probability. The odds is the ratio of the probability that an event occurs to the probability that it does not. For example, the probability of rolling a six when you roll a dice is 1/6 and the probability that you don’t roll a six is 5/6. The odds of rolling a six (the ratio of the probability of rolling a 6 to the probability of not) is therefore 1:5 or ‘1 to 5’.
It’s easy to calculate the odds of rolling a 6 because we already know the required probabilities. However, in many real-world situations we don’t know the underlying probabilities but have collected some data on the number of times that events occur. The odds can be estimated using the ratio of the number of times an event occurs to the number of times it does not. For example, the table below has some fictional results from a study on the impact of a crime reduction intervention on offending. We can use this table to estimate the odds that someone in the intervention group offends. The table shows that one participant in the intervention group offended while 29 did not, out of a total of 30 in the group. This means the odds of offending for participants receiving the intervention is 1:29 or ‘1 to 29’. Similarly, the odds of someone in the control group offending is 9:21 or ‘9 to 21’.
| Offends | Does not offend | Totals | |
| Intervention group | 1 | 29 | 30 |
| Control group | 9 | 21 | 30 |
| Totals | 10 | 50 | 60 |
So we have calculated two separate odds: the odds of offending for the intervention group and the odds of offending for the control group. We can use these odds to calculate the odds ratio, which is simply the ratio between these two odds. You calculate it by dividing the odds in the intervention group by the odds in the control group and it is usually presented as a single number. The odds ratio in our example is 0.08:
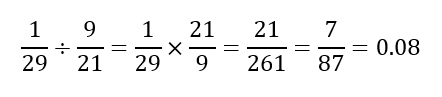
Given that offending is an adverse event we are hoping to reduce, an odds ratio of less than one suggests that the intervention was effective. It means the odds of offending in the intervention group (the numerator) are less than the odds of offending in the control group (the denominator).
If the intervention was ineffective then the odds of offending in the intervention group would be about equal to the odds of offending in the control group. If you divide a number by itself, you get 1 (2/2 =1). So, an odds ratio of 1 suggests the intervention was ineffective.
If the intervention was harmful (i.e. it increased the risk of offending) then the odds of offending in the intervention group would be greater than the odds of offending in the control group. If you divide a number by a smaller number, you get a number greater than 1. So, any odds ratio greater than 1 suggests that the intervention was harmful.

Leave a comment